Know the odds on every inventory position.
Current planning systems give you one number and cover variability with backward-looking safety stock. River predicts forward-looking demand, supply, and inventory distributions, then processes the odds into recommendations planners can act on.
The one-number trap
In a mainstream APS, the demand plan is a single value. The system creates supply orders to match, and you see a resulting inventory level that assumes this plan is what will happen. There is no visibility into what else could happen.
Target Inventory = 100 units
Plan Supply Order = 120
...Are we sure this is exactly what will happen?
Demand has a shape
A demand plan is a single point on a distribution of outcomes. Real demand is almost never symmetric — and the shape depends on how the product sells.
Products that sell every week
Right-skewed demand — a floor at zero, but no ceiling.
- One big order or one promo, and the right tail stretches out.
- Every major safety-stock formula assumes symmetric, normally-distributed forecast error, which systematically under-covers the tail that actually hurts you.
Product with sales every-week. The question is how much. Right-skewed, with a long upper tail that symmetric safety-stock formulas never cover.
Products that sell occasionally
Intermittent demand: most weeks have zero orders, punctuated by spikes.
- A single-number forecast is useless: forecast zero every week and miss every sale, or smooth the average and overstock.
- River's output is a calibrated probability. When River says "60% chance of an order this week," orders actually land in roughly 60% of those weeks.
Supply is a complex process, with more than one distribution
Supply uncertainty doesn't follow a normal curve either. There are multiple distinct supply risks most planning systems don't capture:
Delayed shipment:
When is this order actually going to land?Lead-time shifts backward and the shipment arrives later than planned.
- Plant schedule slips, lane reliability degrades, or upstream deployment misses its window.
- Your planning system carries one fixed lead-time in master data. Things happen, and sometimes it's wrong.
- Updating your master data still can't reflect delays that are possible but uncertain.
Short-ship:
How much is actually going to show up?Shipment contains fewer units than you ordered.
- Yield loss, partial allocations, or a plant/supplier trimming to what they could actually produce.
- Your plan assumes what you order = what you get.
- The process is designed to fix quantity shortages after they occur. This is a major reason why we end up with so many exceptions.
No-ship:
Am I even going to receive this order?Shipment doesn't arrive at all.
- A shipment cancels, a lane closes, or a plant goes down for unscheduled maintenance.
- No simple safety-stock formula covers a point mass at zero. There's nothing to put a standard deviation around.
River models supply as two separate distributions: lead-time and quantity — fed by plant schedule attainment, deployment adherence, lane reliability, yield, and order fill. Their joint probability shows the shape of what you're actually likely to receive, versus what you ordered.
Putting it Together: Inventory Simulation
Demand and supply are the inputs, and Inventory is the outcome.
Once we have the curves for Demand and Supply, we simulate what could happen to inventory. We run the simulation 1,000s of times in a classic Monte Carlo, which generates the curve of likelihood for inventory positions.
The shape of the curve is rarely normal, and it is these odd shapes, which represent real life, showing you the existence of tail risk that breaks safety stock.
We can now answer: What are the real-life odds of an out-of-stock? Of excess?
Correcting Your Plan to Even the Odds
Knowing the odds of value loss is just step 1. River uses the odds to recommend how you can make better bets.
For every item-location-week, River looks at the inventory distribution and runs an optimization that asks:
What change to the existing supply plan will reduce the odds of value loss, and bring the position back in range?
The output is a correction: a specific quantity to add or remove from the planned supply order.
When the risk is large, the correction is more aggressive. When the risk is small, the correction is less aggressive.
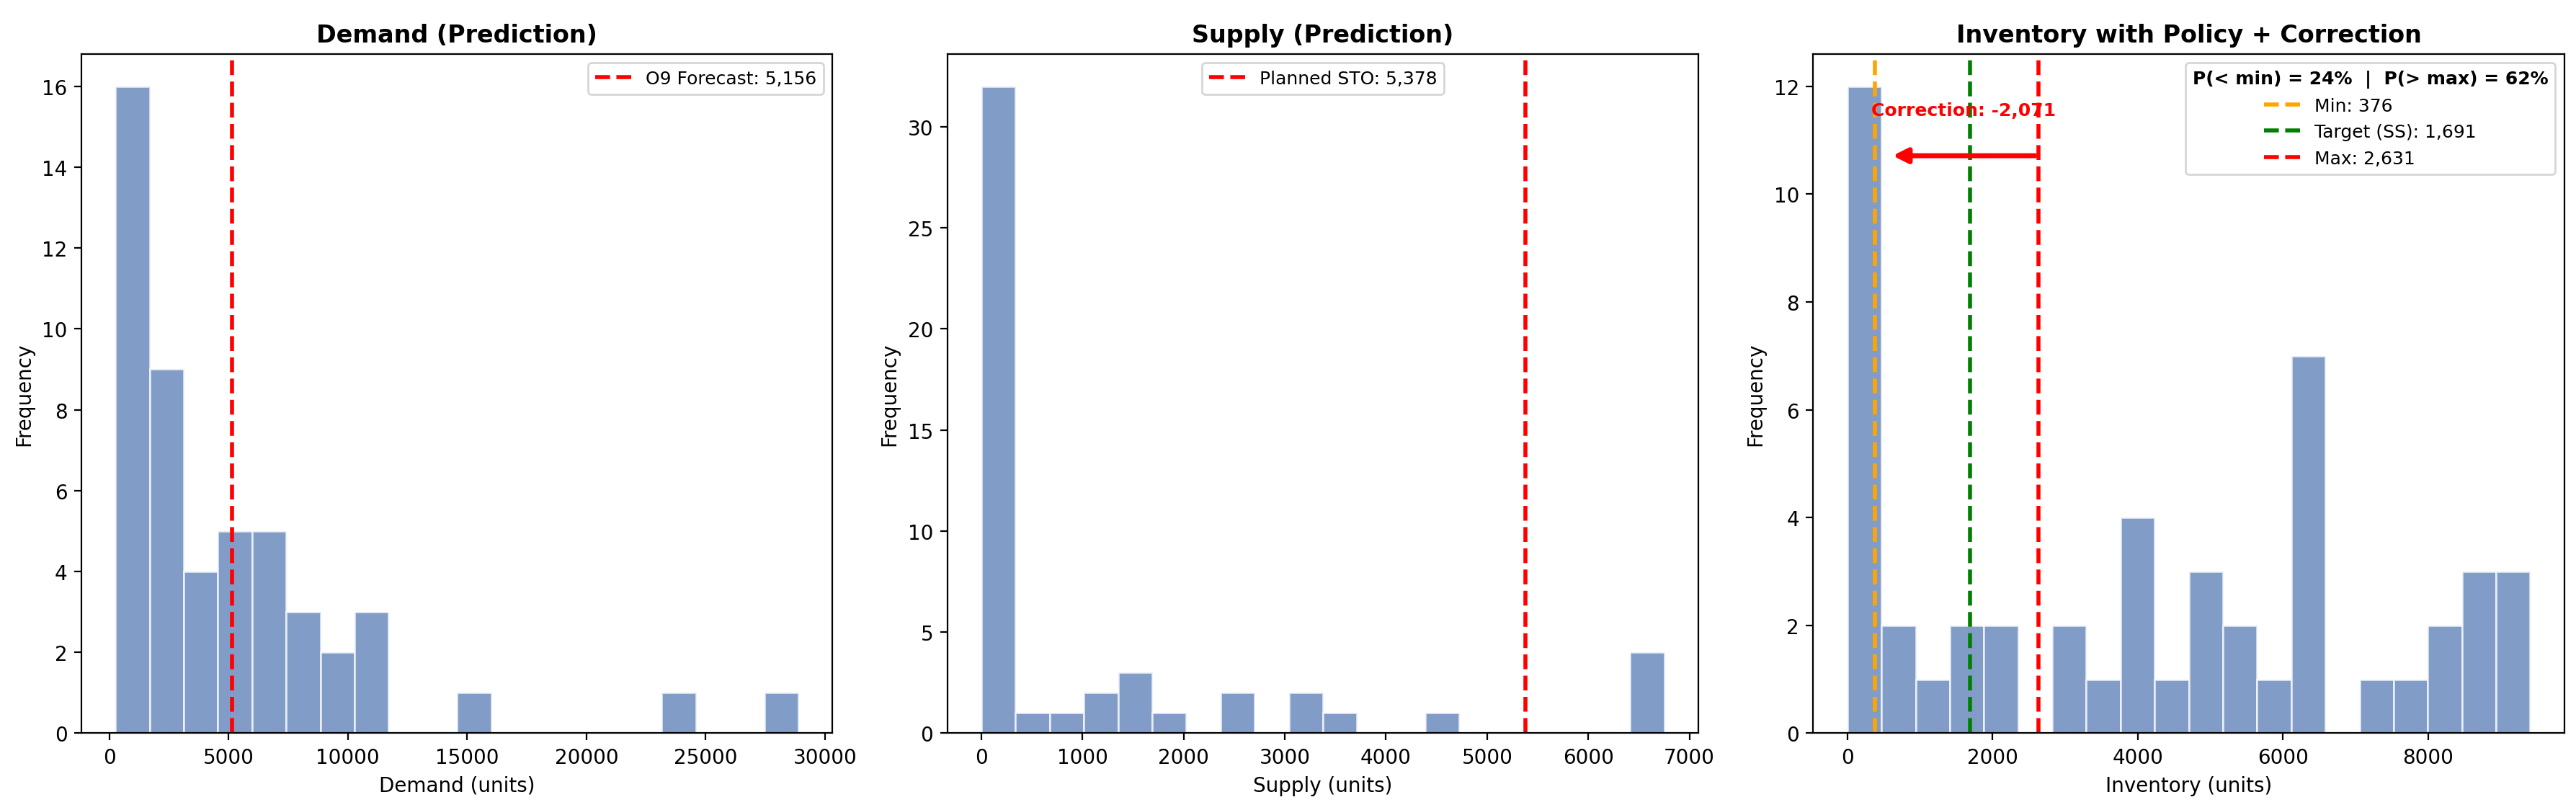
What River Saw in Real Time
Planned demand was 5,156 units, and planned supply was 5,378. But River saw heavy downside risk in both demand AND supply.
River ran 1,000s of inventory simulations, and identified a 62% risk of value loss due to excess inventory above the Max policy target.
Therefore, River optimization recommends a correction of −2,071 units to bring the position back in range.
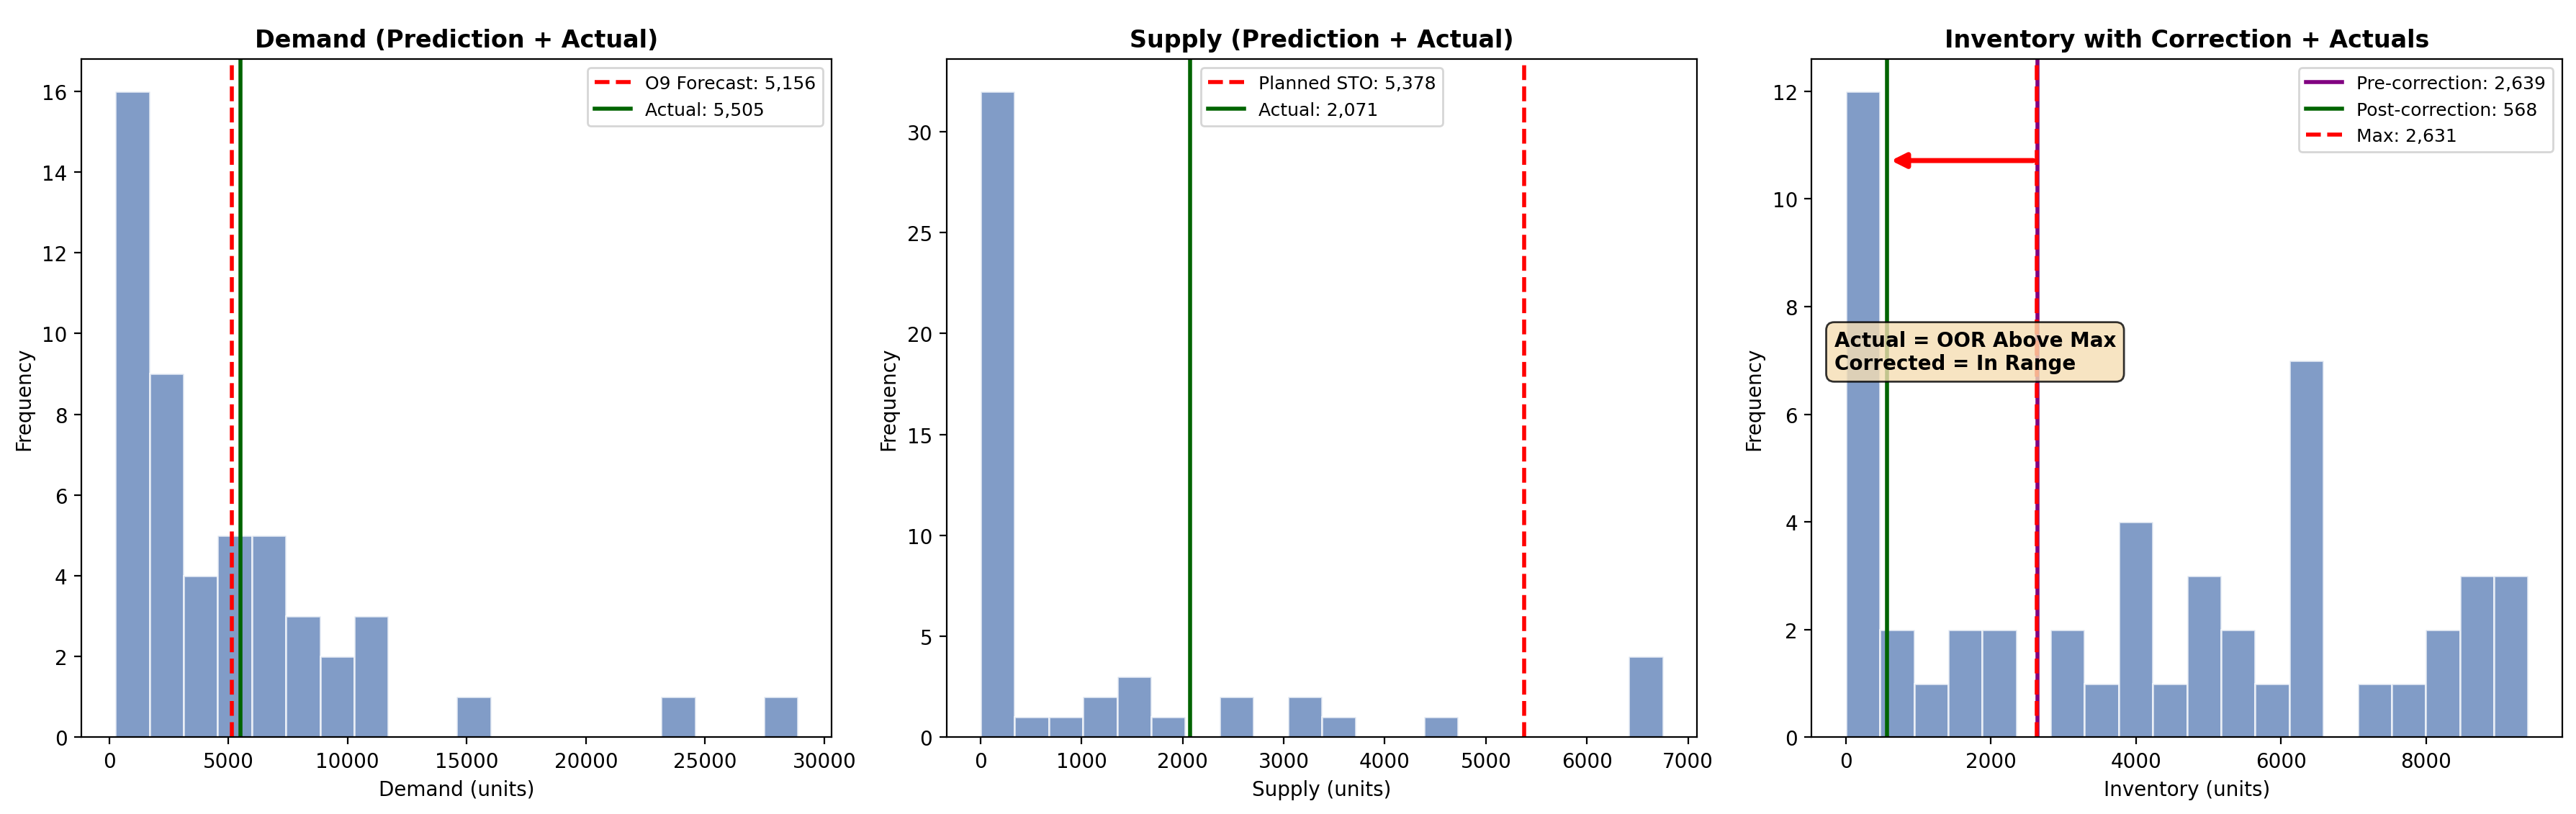
What Actually Happened: River Was Right
After the week played out, actual demand landed at 5,505 units (close to forecast) but actual supply came in well below plan, more in line with the odds.
So, actual inventory was above the max target, in line with the odds, despite being far different than plan.
River saw it coming, and issued a correction to the plan that would have brought inventory back into range, avoiding excess.